



TL;DR: Use trend analysis tools to catch key market moves early and adjust your strategy.
Traditional market analysis can leave you guessing. Trend tools mix solid numbers with clear insights so you can track earnings ratios and assess portfolio risks before big trends hit the headlines. Skipping these tools might mean missing signals that could boost your strategy. This post compares leading platforms that break down complex data, so you can act fast and with confidence in today’s dynamic market.
Core Trend Analysis Tools for Investors: A Comparative Overview
TL;DR: Choose the right trend analysis platform based on your role to quickly interpret market data and act fast.
Investors looking for clear, usable market insights turn to advanced analysis platforms. These tools mix hard numbers (like EPS and P/E ratios) with softer insights (such as management quality and market position) to help you evaluate trends and make informed moves.
Modern platforms come in different types to suit various needs. Some, like Quandl, offer vast alternative datasets ideal for data experts and hedge funds. Others, such as BlackRock's Aladdin, focus on risk management by stress testing portfolios. For those needing up-to-the-minute news and dynamic charts, Refinitiv Workspace and Bloomberg Terminal are solid choices. Meanwhile, FactSet and Morningstar Direct deliver deep analytics and ongoing performance tracking.
| Tool | Best For | Key Features |
|---|---|---|
| Quandl | Data Scientists, Hedge Funds | Alternative datasets: macroeconomic indicators, commodity prices, equity data |
| Aladdin by BlackRock | Portfolio/Risk Managers | Risk management with stress testing and scenario analysis |
| Refinitiv Workspace | Active Traders, Investors | Real-time global data, breaking news, market updates |
| FactSet | Analysts, Modelers | Global data integration and robust analytics for performance monitoring |
| Morningstar Direct | Research Analysts, Fund Managers | Detailed analytics and fund metrics for equities, ETFs, mutual funds |
| Bloomberg Terminal | Professional Investors | Real-time market data, exclusive news, advanced charting tools |
This snapshot helps you quickly spot each platform's strengths so you can pick the one that fits your investment style and decision-making needs.
Data-Driven Market Insights with Investment Trend Scanning Platforms

Quandl offers a wide range of financial data that can help build strong market models. It includes macroeconomic numbers, commodity prices, and stock data. Data scientists can use Quandl to check market volatility quickly, making sure their models rely on solid facts.
Xpressfeed delivers both real-time and historical data across many asset classes. Its feeds work smoothly with portfolio management systems and quantitative models. With Xpressfeed, portfolio managers can update their financial inputs automatically, making trend spotting and risk checks easier.
Using both platforms gives investors the tools to improve their trend analysis. They both provide accurate, high-quality data that supports smart decision-making. This combination helps market watchers measure performance, refine forecasts, and adjust strategies as markets change.
Leveraging Technical Analysis Software for Chart Pattern Recognition
Technical analysis software helps traders spot repeated chart patterns and trends quickly. It uses tools like moving averages, oscillators (devices that show price momentum), and volume trends to spot shifts in the market. By watching how the price interacts with these tools, traders can find good times to buy or sell.
FactSet pulls together financial data from around the world and offers tools for real-time stock tracking and financial modeling. Its charts clearly show trend lines and moving averages so investors can spot important changes. This clear visual approach makes it easier to make sense of complex market signals.
Bloomberg Terminal steps up trend detection with smart drawing tools and real-time data. It lets you set up customizable indicators like oscillators and drawing features to identify key support and resistance levels. With exclusive news and dynamic charts, Bloomberg Terminal gives you a strong platform to catch shifting market trends.
Predictive Market Analytics and Algorithmic Trend Tracking Techniques

Machine learning is now a trusted tool for forecasting market trends. Investors rely on algorithms that scan huge amounts of historical data to spot small shifts before they grow obvious. Even tiny price changes can light the early warning that traders need to adjust their positions. These tools offer faster, more reliable trend signals that keep up with the fast pace of the markets.
BlackRock’s Aladdin is a great example. It uses risk assessment and stress testing to paint a clear picture of potential outcomes in volatile conditions. Its scenario analysis (see quantitative risk analysis at https://buzdaily.com?p=1185) helps portfolio managers tweak their strategies before risks hit. With integrated tools, investors can quickly understand potential market impacts and act fast.
Algorithmic trading systems take this a step further by analyzing past performance to generate clear, predictive signals. They monitor market history non-stop, turning raw data into easy-to-follow indicators. This automation helps investors react swiftly when major market changes occur, keeping them one step ahead.
By blending machine learning forecasts, risk assessments, and algorithmic signals, investors build a robust strategic framework. These combined tools refine actionable insights that match top investment strategies (more details at https://moneyrepo.com?p=3087). This integrated approach not only catches market trends in real time but also supports fast, proactive moves in a shifting market.
trend analysis tools for investors shine with insight
Free platforms make it simple for investors to tap into market trends and consumer behavior without any extra cost. These tools let you track economic shifts and changes in market share easily. You can quickly spot shifts in what consumers like and how firms stack up against rivals.
- TIKR: Get a global view of market share with over 15 years of financial data. Its quick Valuation Model estimates a stock's potential in less than 60 seconds, perfect for long-term trend watchers.
- Similarweb: Check website traffic and engagement to see how companies perform online, especially those that are digitally focused.
- Statista: View market share percentages and a trove of infographics. Even though some in-depth reports require a subscription, the free data offers a clear picture of industry trends.
- Owler: Use a community-driven Competitor Graph to spot key rivals fast. It gives you an instant overview of market rankings.
- Google Trends: Watch regional and time-based search interests as a quick proxy for changes in consumer preferences.
- CSIMarket: See industry-level tables showing year-over-year market share shifts so you can track changes in competitive landscapes.
Integrating Trend Analysis Tools for Investors into Decision Strategies
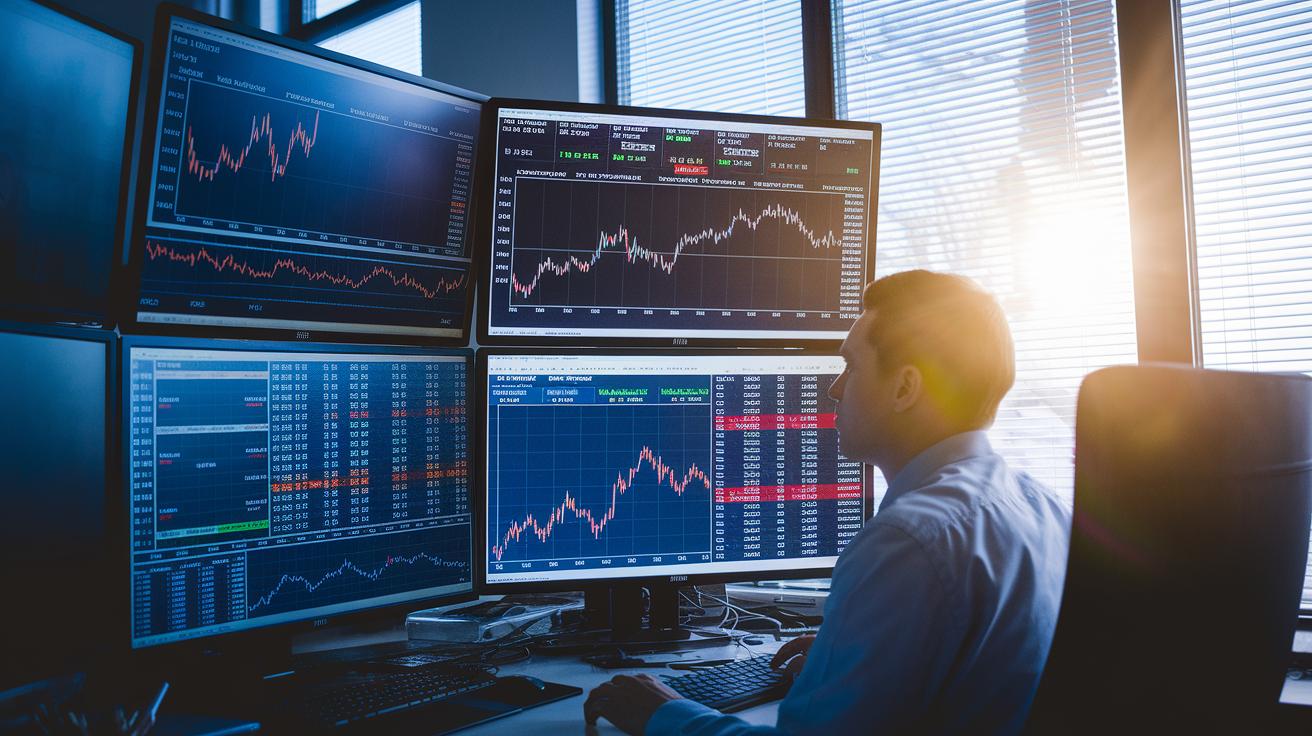
TL;DR: Use a mix of web tracking, real-time data, charting, and forecasting tools to decide when to buy or sell.
Start with a clear plan. A strong strategy blends hard numbers like market share and stock price trends with insights about brand reputation and management quality. By combining these, you can spot good times to enter or exit positions and keep your portfolio on track.
Here’s how to build your system:
- Decide which trend numbers matter most to you, think growth rates and volatility.
- Choose tools that offer both solid data and easy-to-understand insights.
- Connect your data feeds so you see market trends all together.
- Set up quick notifications that alert you when big market moves happen.
- Check your results often and fine-tune your strategy as market signals change.
Final Words
In the action, we broke down top trend analysis tools for investors, covering everything from data access to real-time charting. We compared platforms like Quandl and Bloomberg Terminal and explored ways predictive analytics help shape decisions. Next, we looked at free solutions like Google Trends and how to integrate these insights into your strategy. Each insight adds to a stronger, more actionable framework. Embrace these points and use trend analysis tools for investors to steer your portfolio confidently forward.
FAQ
What free trend analysis tools can investors use?
The free trend analysis tools offer investors ways to track market sentiment using platforms like Google Trends, Similarweb, and CSIMarket, which help gauge consumer interest and market shifts.
What are the best free stock analysis apps and websites?
The best free stock analysis apps and websites combine real-time data, charting, and market news, offering both beginners and active traders a cost-effective way to monitor stocks and trends.
Which tool is best for trend analysis?
Which tool is best for trend analysis depends on your needs; for example, Bloomberg Terminal provides advanced real-time data, while free tools like Google Trends offer valuable consumer interest insights.
What is the 3 5 7 rule?
The 3 5 7 rule outlines a structured approach to analysis by focusing on three core indicators, five supporting metrics, and seven key data points to guide decision-making.
Which top 10 shares should I buy today?
Which top 10 shares to buy today varies based on market conditions and personal investment goals, so use comprehensive analytical tools and professional guidance to refine your choices.
Can ChatGPT analyze stocks?
ChatGPT can review historical data and market trends to offer insights, but it is not a substitute for real-time analytical tools or professional investment advice.