



TL;DR: Discover the top 10 equity markets that together power a global economy worth roughly $127 trillion.
Have you ever thought about which exchanges drive our global economy? They add up to nearly $127 trillion in market value. Key players include the historic NYSE (New York Stock Exchange) and the energetic NASDAQ alongside major exchanges in Asia and Europe. This post breaks down each market and explains how they earned their roles at the heart of global finance.
Top 10 Largest Equity Markets by Market Capitalization
Global stocks now total about $127 trillion. This huge number shows just how big the world of equities has grown. If you want to get a clear picture of where the market power lies, check out our ranking of the top ten exchanges.
The United States leads the pack with two major exchanges: NYSE and NASDAQ. NYSE, launched in 1817, has become a global finance mainstay, while NASDAQ, which started in 1971, helped popularize electronic trading. Meanwhile, Japan’s Tokyo Stock Exchange and China’s exchanges, Shanghai, Hong Kong, and Shenzhen, also play a big role in driving global market growth.
Below is a simple table that sums up the key details for each of these market giants:
| Rank | Exchange | Country | Market Cap (USD Trillion) | Year Established |
|---|---|---|---|---|
| 1 | NYSE | USA | 25 | 1817 |
| 2 | NASDAQ | USA | 15 | 1971 |
| 3 | Tokyo Stock Exchange | Japan | 6 | 1878 |
| 4 | Shanghai Stock Exchange | China | 5 | 1990/1866 |
| 5 | Hong Kong Stock Exchange | China | 4.5 | 1891/1914 |
| 6 | London Stock Exchange | UK | 3.5 | 1698/1801 |
| 7 | Euronext | Euro zone | 3 | 2000 |
| 8 | Shenzhen Stock Exchange | China | 2.5 | 1987/1990 |
| 9 | Toronto Stock Exchange | Canada | 2 | 1852 |
| 10 | Frankfurt Stock Exchange | Germany | 1.5 | 1585 |
Investors use data like this to decide where to look for market opportunities. Compare these market cap numbers to see which exchanges offer more liquidity and historical strength. Whether you’re examining legacy giants like NYSE or faster-growing markets such as Tokyo and Shanghai, this ranking gives you a clear roadmap to guide your next move.
Largest Equity Markets in the World: Rising Stars
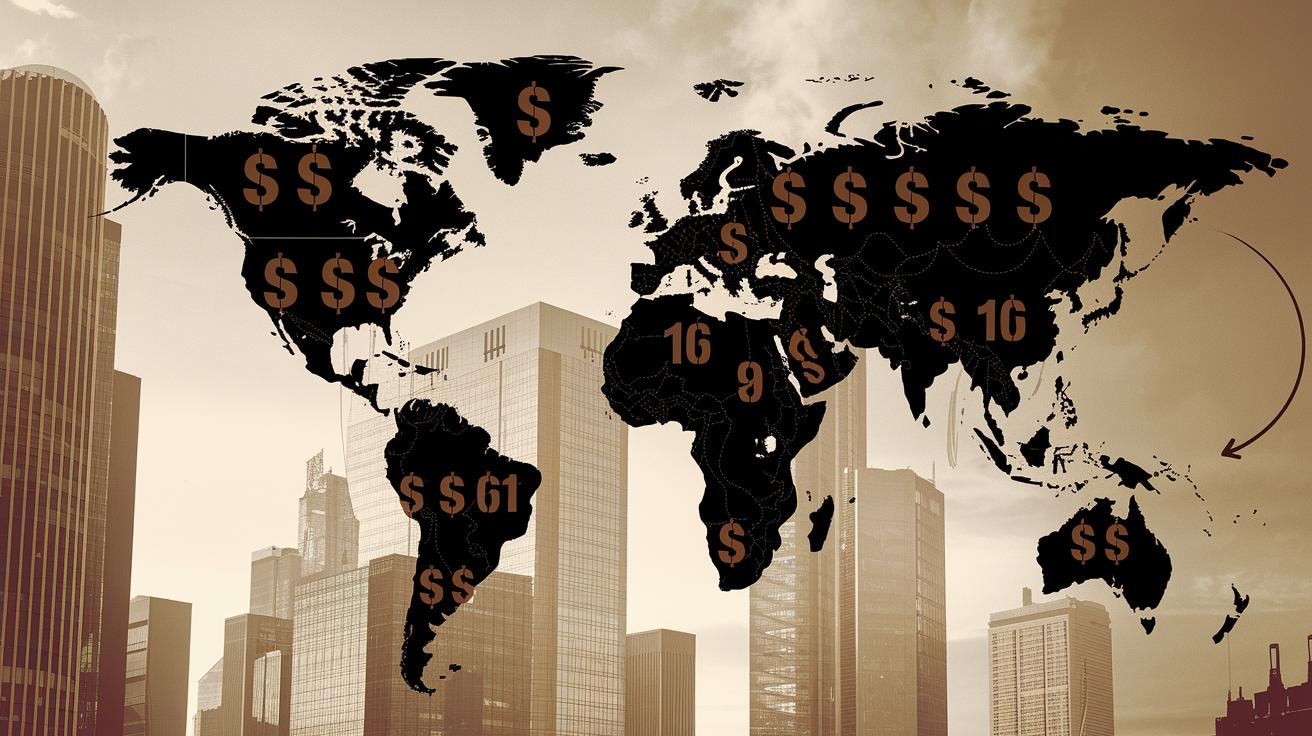
Major equity markets have deep historical roots. The London Stock Exchange started back in 1698 and earned its official charter in 1801, while the Frankfurt Stock Exchange dates to 1585 and was updated after World War II. These early players set the stage for today's global market.
The 20th century brought rapid growth. The New York Stock Exchange began in 1817 and gained a dominant role after World War I. The Tokyo Stock Exchange, launched in 1878, paused between 1945 and 1949 because of postwar struggles. Like an athlete resting before a strong comeback, Tokyo’s trading soon rebounded and grew.
The electronic era reshaped how trading happens. NASDAQ was born in 1971 to facilitate computer-driven deals. In 2017, the Hong Kong Stock Exchange transitioned fully online by closing its trading floor. This move is like shifting from face-to-face bartering to fast, online transactions.
Recent mergers have further transformed the market landscape. Tokyo now operates under the Japan Exchange Group after merging in 2013. Meanwhile, Shanghai, whose market roots stretch back to 1866 and was reestablished in 1990, is emerging as a key player. Euronext (created in 2000), Shenzhen (active since 1990), and the TSX (since 1852) show that global equity markets are constantly evolving.
Regional Comparisons of Top Equity Markets
Global equity markets show different strengths based on local factors and setups. In North America, U.S. markets lead with the New York Stock Exchange (NYSE) taking the top spot and NASDAQ close behind. The Toronto Stock Exchange (TSX) matters too, even at ninth place.
Over in Asia-Pacific, busy exchanges drive growth. The Tokyo Stock Exchange comes in third, while China’s markets, Shanghai Stock Exchange in fourth, Hong Kong Stock Exchange in fifth, and Shenzhen Stock Exchange in eighth, add momentum. Remember, the overall U.S. market remains over five times larger than China’s.
European hubs also play a key role. The London Stock Exchange ranks sixth, Euronext is seventh, and Frankfurt Stock Exchange holds tenth place, attracting many international listings.
| Region | Exchanges & Rankings |
|---|---|
| North America | NYSE (#1), NASDAQ (#2), TSX (#9) |
| Asia-Pacific | Tokyo Stock Exchange (#3), Shanghai Stock Exchange (#4), Hong Kong Stock Exchange (#5), Shenzhen Stock Exchange (#8) |
| Europe | London Stock Exchange (#6), Euronext (#7), Frankfurt Stock Exchange (#10) |
U.S. exchanges dominate due to broad domestic listings and open market policies. Still, other regions shine with unique advantages in innovation and regulatory environments. This mix of traditional powerhouses and emerging stars gives investors a clear, cross-national view of market strengths and opportunities.
Regulatory and Market Dynamics Driving Scale in Major Equity Markets
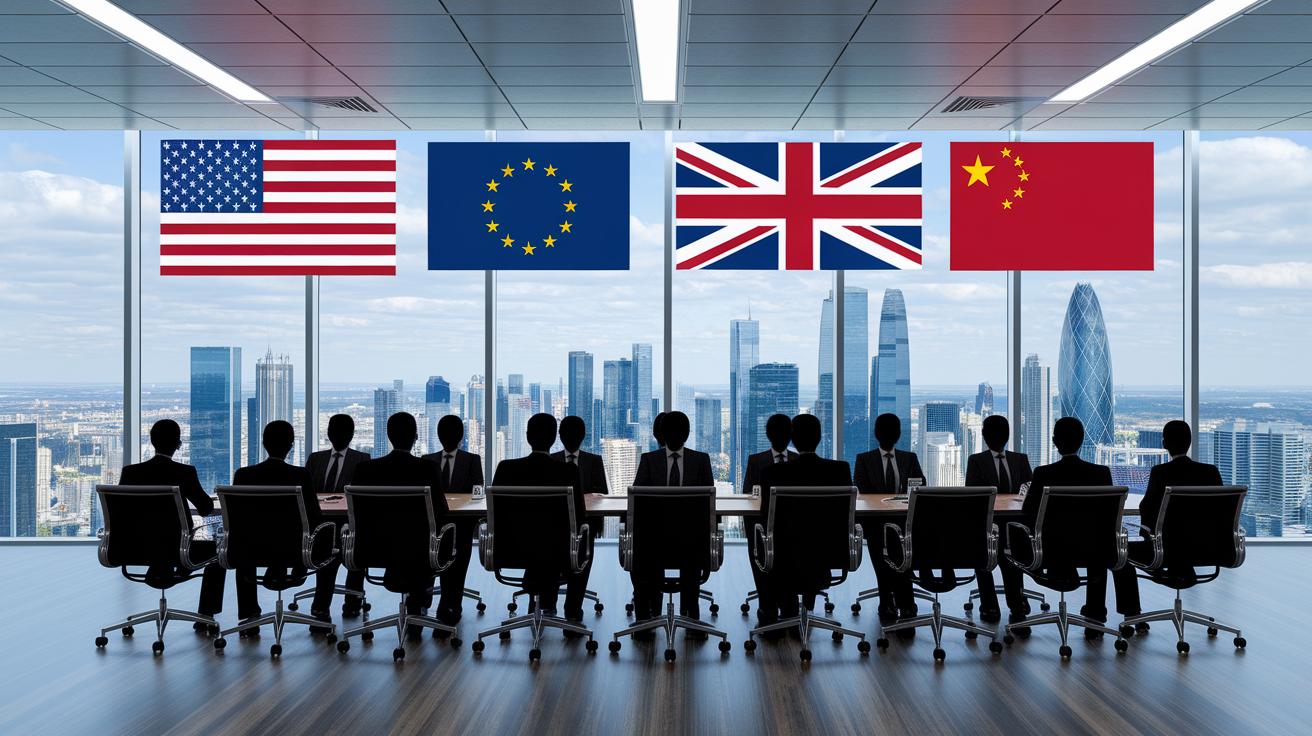
Regulatory Frameworks: Overview of U.S., EU/UK, China, and emerging-market policies
Regulators play a big role in building market scale and boosting investor trust. In the U.S., open-market rules along with reforms like Sarbanes-Oxley (2002) and Dodd-Frank have made companies more transparent and accountable. In Europe and the UK, crisis-driven changes shifted stock exchanges such as the London Stock Exchange and Euronext to better meet the needs of a wide range of investors. Over in China, strict foreign-ownership limits and a high number of state-owned firms mean its equity market stays smaller compared to its booming economy. Emerging markets like those in Shanghai and Shenzhen have also seen growth thanks to careful regulatory tweaks. Think of these changes as a fresh burst of wind boosting investor confidence and pushing the market ahead.
Ownership Structures: State-owned enterprises vs. domestic listing diversity
Market size is also affected by who owns the stocks. In places like the U.S. and parts of Europe, a mix of domestic listings creates a broad and diverse investment scene. This diversity spreads risk and encourages companies from different sectors to innovate. In contrast, many markets in China are driven by state-owned companies, which can limit the number of choices available to investors. Imagine it like this: a basket full of varied, privately owned companies signals energy and innovation, while a basket dominated by state-run firms might move more slowly. This factor is key when judging market resilience and future growth.
Technological Adoption: Impact of electronic-trading platforms
Modern technology helps markets work faster and smoother. Electronic trading has been a game changer. NASDAQ led the way in 1971 by moving to computer-based trading, revolutionizing trade execution. More recently, the Hong Kong Stock Exchange switched to an all-electronic system in 2017. This shift sped up trades and lowered costs, making transactions more efficient. Upgraded digital platforms even shrink the gap between bid and ask prices, lowering barriers for both retail and institutional investors. Think of it as an engine upgrade for a high-performance car: it improves speed and reliability. For more on digital trends, check out digitization trends in financial reporting (https://moneyrepo.com?p=1901). These tech shifts not only meet current market demands but also set the stage for future growth, attracting global investors.
Liquidity and Trading Volume in the Largest Equity Markets
TL;DR: U.S. markets offer deep liquidity that makes trading large positions simple and efficient.
The global stock market now totals around $127 trillion. This huge number means there’s plenty of liquid stock available. The NYSE and NASDAQ drive most daily trading. Their strong volumes help both quick, high-speed trades and big block deals happen smoothly. SIFMA reports show that most of this action comes from domestic stocks, setting up a solid trading base. While Chinese exchanges are ramping up their activity, their numbers still don’t match what we see in the U.S.
For anyone trading stocks, this liquidity makes it easier to jump in and out of big positions without sudden price swings. When checking market conditions, consider these key measures:
- Average daily volume
- Turnover ratio
- Bid–ask spread
- High-frequency trading (HFT) share
- Block trade capacity
Future Outlook and Trends for the World's Largest Equity Markets
TL;DR: Global markets are evolving fast with new tech, sustainable finance, mergers, and more open emerging markets.
The global equity market stands at roughly $127 trillion. Digital change is reshaping trading, driven by both innovation and tighter rules. For example, NASDAQ and HKEX started using automated platforms that let trades happen faster and more reliably. Companies are also turning to sustainable finance by adding ESG (environmental, social, and governance) standards to their listings. Mergers like the NYSE-Euronext union show that partnerships can boost market efficiency and liquidity. Meanwhile, emerging markets like the SSE and SZSE are poised to grow as restrictions on foreign investments ease.
Key trends to watch include:
- Digital integration: New tech is making trade execution and efficiency better.
- ESG listings: More firms are adopting sustainable finance standards.
- Cross-border mergers: Consolidation is streamlining operations.
- Emerging-market openings: Looser foreign-investment rules could unlock fresh growth.
Final Words
In the action, we ranked and compared the world’s top exchanges by market cap and traced their historical roots. We examined regional differences, regulatory shifts, and trading liquidity that drive growth. Our analysis shed light on the key market factors and risks at play.
Clear trends point to digital expansion, environmentally focused listings, and market mergers. The outlook remains encouraging for those tracking the largest equity markets in the world. Stay sharp and ready to act on these market insights.
FAQ
What are the largest equity markets and stock exchanges in the world?
The largest equity markets are ranked by market capitalization and include exchanges such as the NYSE, NASDAQ, Tokyo Stock Exchange, Shanghai Stock Exchange, along with others featured on lists of the top 10, 20, or even 50.
What is the largest equities market in the world?
The largest equities market is identified as the New York Stock Exchange, which leads in market capitalization and trading volume, making it a central hub for global equity trading.
What are the top 3 equity markets?
The top three equity markets by market capitalization are usually the New York Stock Exchange, NASDAQ, and Tokyo Stock Exchange, each known for robust liquidity and high trading activity.
Which is the largest trading market in the world?
The largest trading market is the New York Stock Exchange, recognized for its high liquidity and extensive volume, which underpin its global prominence in equity trading.
What is the “Big 7” in the stock market?
The “Big 7” typically refers to the leading group of stock exchanges dominating global trading, generally including the NYSE, NASDAQ, Tokyo, Shanghai, Hong Kong, London, and Euronext.
What are some key global stock exchanges mentioned?
Key global stock exchanges include the New York Stock Exchange, NASDAQ, National Stock Exchange (NSE) of India, Bombay Stock Exchange (BSE), Shanghai Stock Exchange, and NYSE American; each plays a vital role in international finance.